IC Markets Home Assinar em Web Trader Contacte-nos
IC Markets Social IC Markets Social

Centro de Informação para
Traders Sérios

  • Sobre nós
  • ABRA UMA CONTA DE NEGOCIAÇÃO
  • TESTE UM DEMO GRATUITO
  • Comece a Operar
  • Visite nosso blog
IC Markets Social
  • Sobre nós
  • ABRA UMA CONTA DE NEGOCIAÇÃO
  • TESTE UM DEMO GRATUITO
  • Comece a Operar
  • Visite nosso blog
May 16, 2023North_American_Stocks_ptIC Markets

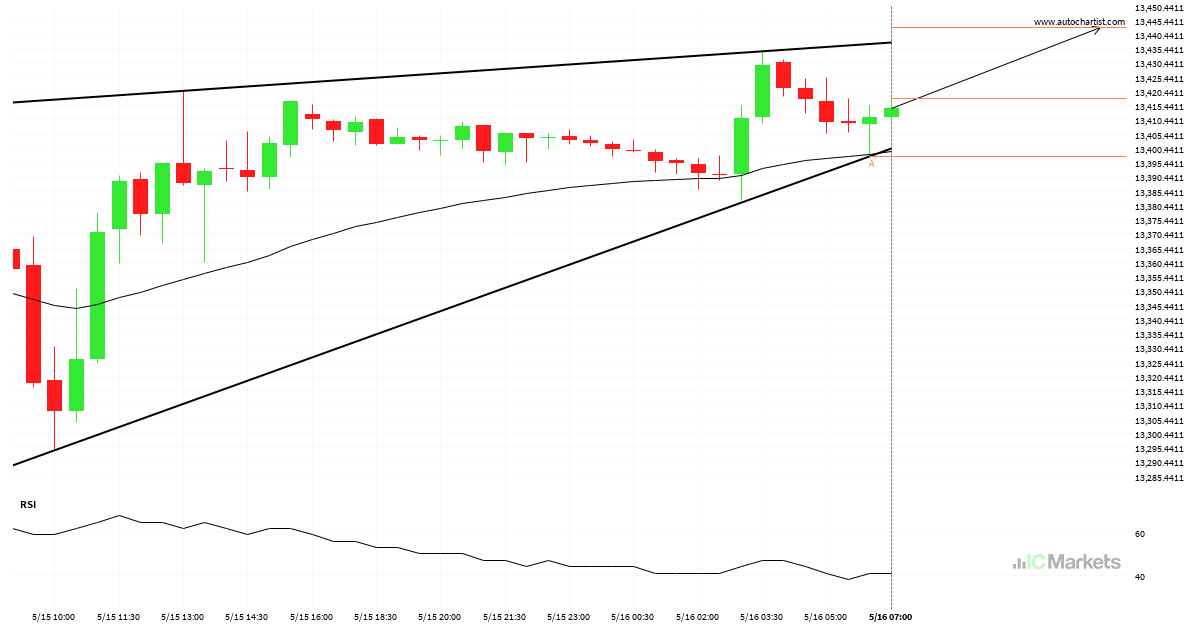
US Tech 100 Index approaching resistance of a Cunha ascendente

US Tech 100 Index is approaching the resistance line of a Cunha ascendente. It has touched this line numerous times in the last 2 days. If it tests this line again, it should do so in the next 6 hours.

Read more
May 15, 2023North_American_Stocks_ptIC Markets

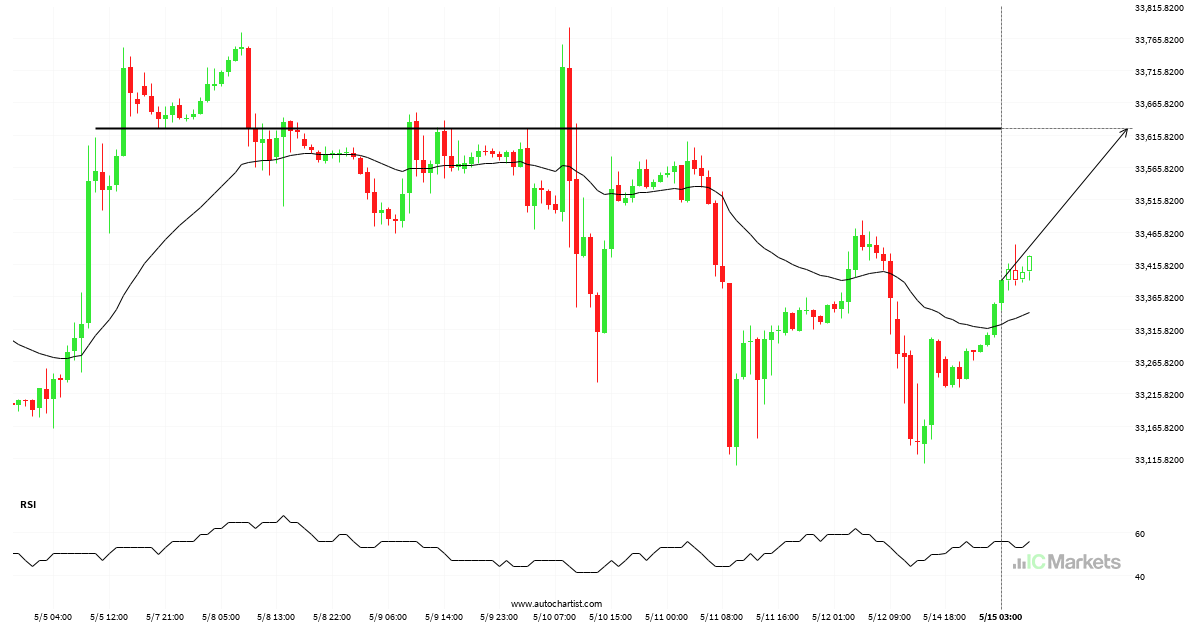
US Wall Street 30 Index – getting close to psychological price line

US Wall Street 30 Index is moving towards a resistance line. Because we have seen it retrace from this level in the past, we could see either a break through this line, or a rebound back to current levels. It has touched this line numerous times in the last 10 days and may test it […]

Read more
May 12, 2023North_American_Stocks_ptIC Markets

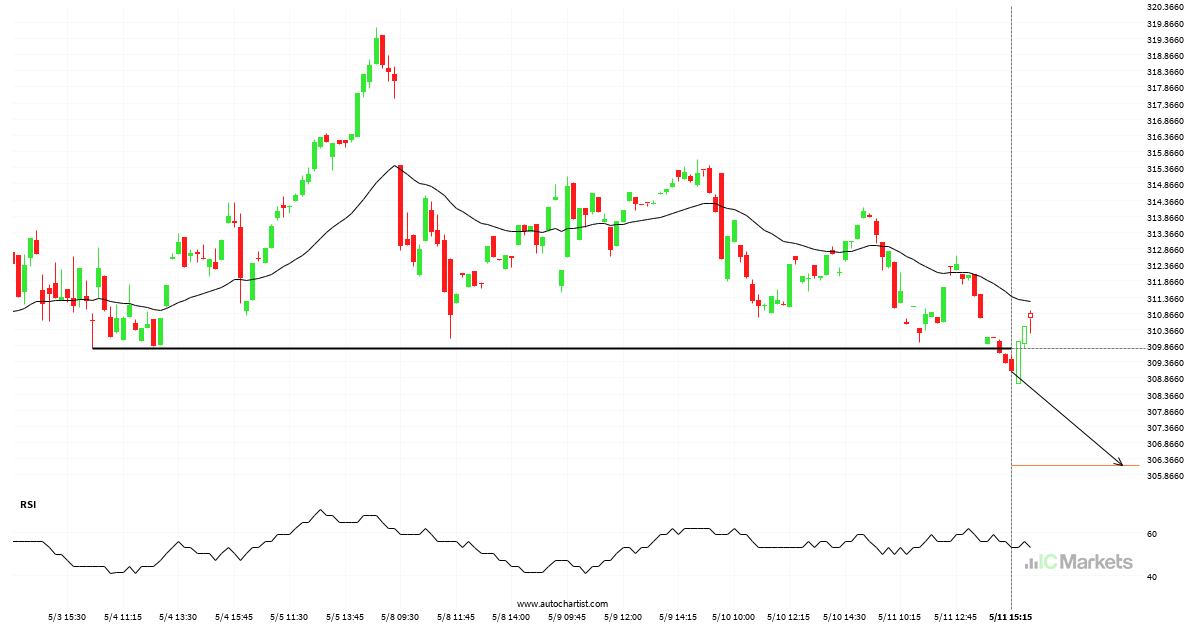
Biogen Idec Inc broke through important 309.7700 price line

Biogen Idec Inc has broken through a support line. It has touched this line numerous times in the last 8 days. This breakout shows a potential move to 306.1700 within the next 8 hours. Because we have seen it retrace from this level in the past, one should wait for confirmation of the breakout.

Read more
May 11, 2023North_American_Stocks_ptIC Markets

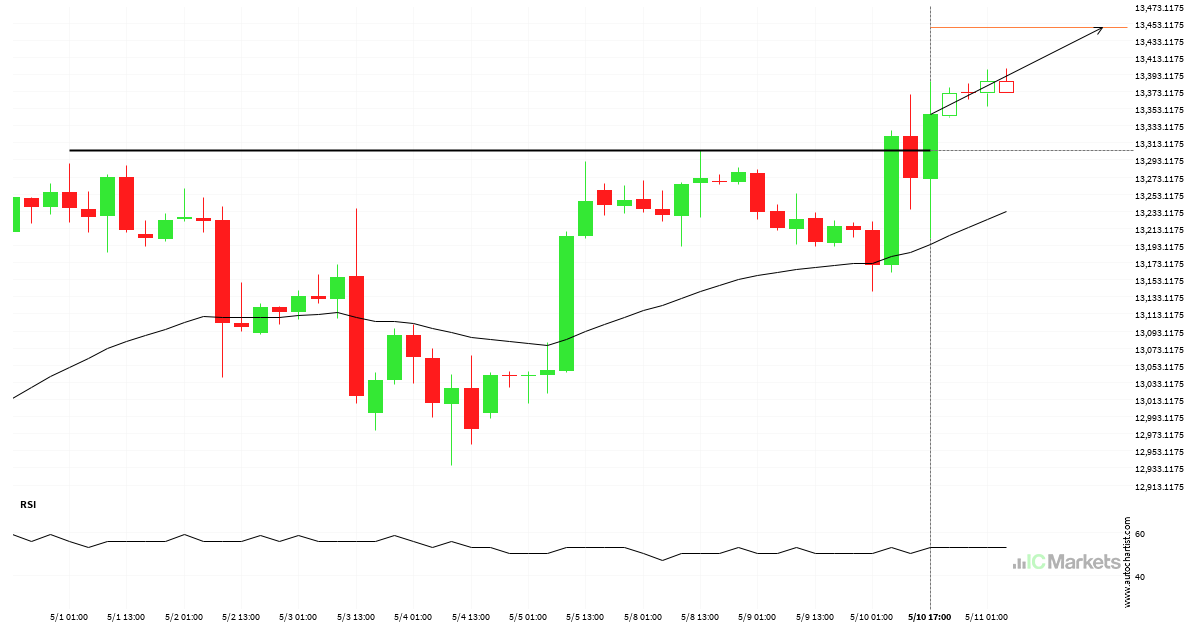
US Tech 100 Index broke through important 13304.5996 price line

US Tech 100 Index has broken through a resistance line. It has touched this line numerous times in the last 10 days. This breakout shows a potential move to 13447.5596 within the next 2 days. Because we have seen it retrace from this level in the past, one should wait for confirmation of the breakout.

Read more
May 10, 2023North_American_Stocks_ptIC Markets

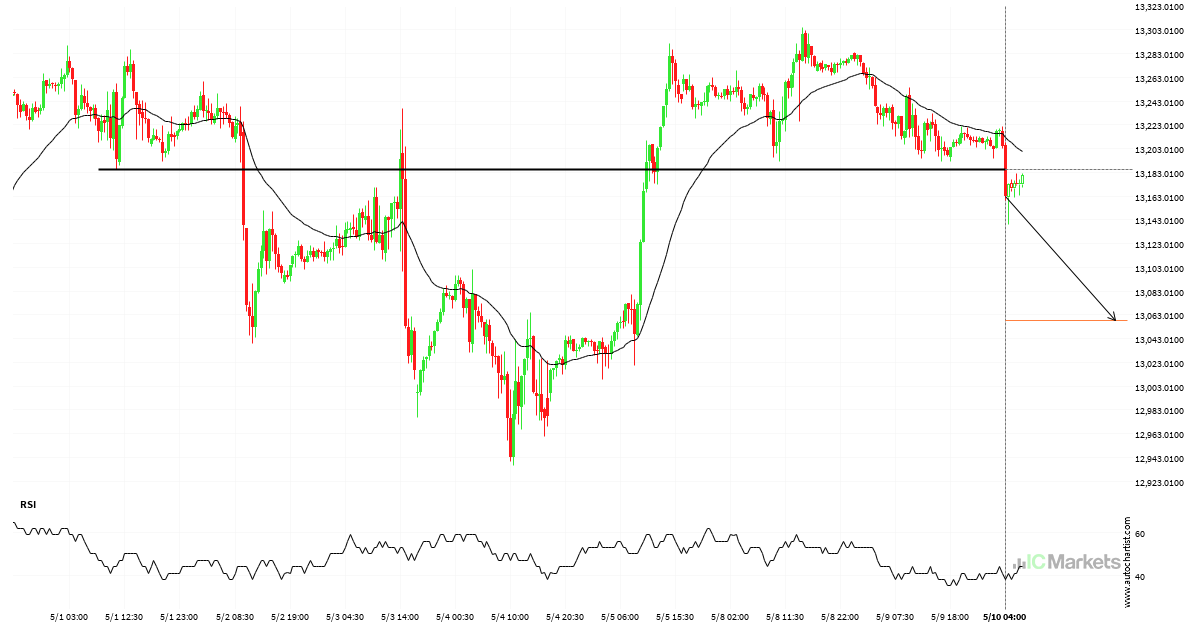
US Tech 100 Index broke through important 13185.2998 price line

US Tech 100 Index has broken through a support line. It has touched this line numerous times in the last 9 days. This breakout shows a potential move to 13058.2998 within the next 2 days. Because we have seen it retrace from this level in the past, one should wait for confirmation of the breakout.

Read more
May 4, 2023North_American_Stocks_ptIC Markets

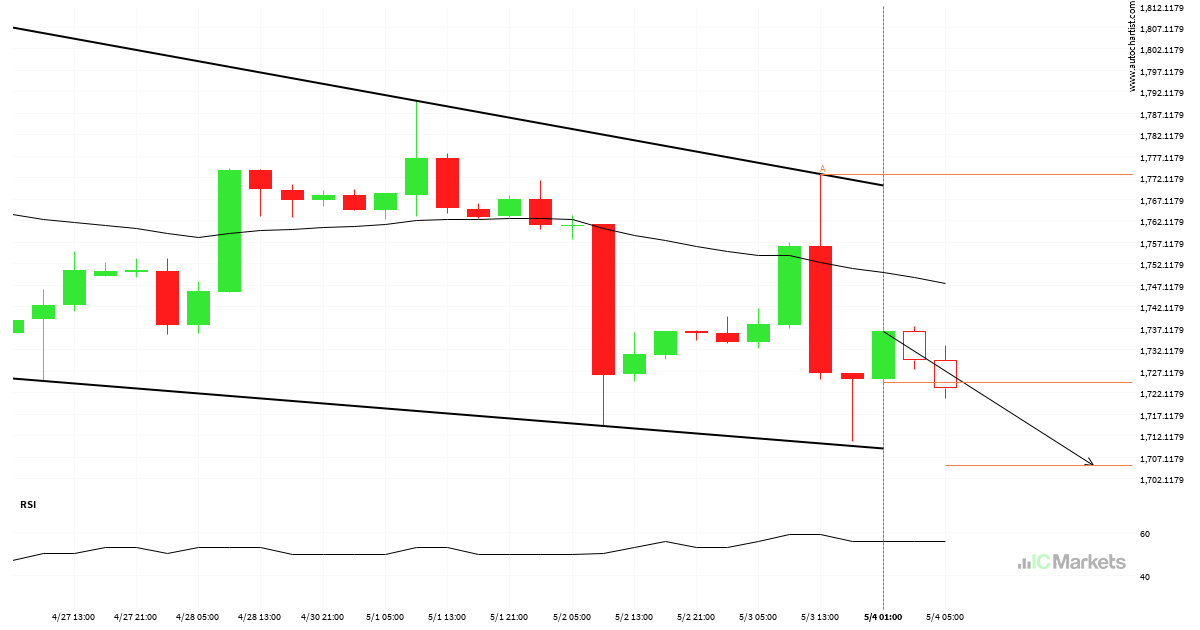
US Small Cap 2000 Index approaching support of a Cunha descendente

US Small Cap 2000 Index is approaching the support line of a Cunha descendente. It has touched this line numerous times in the last 10 days. If it tests this line again, it should do so in the next 2 days.

Read more
May 3, 2023North_American_Stocks_ptIC Markets

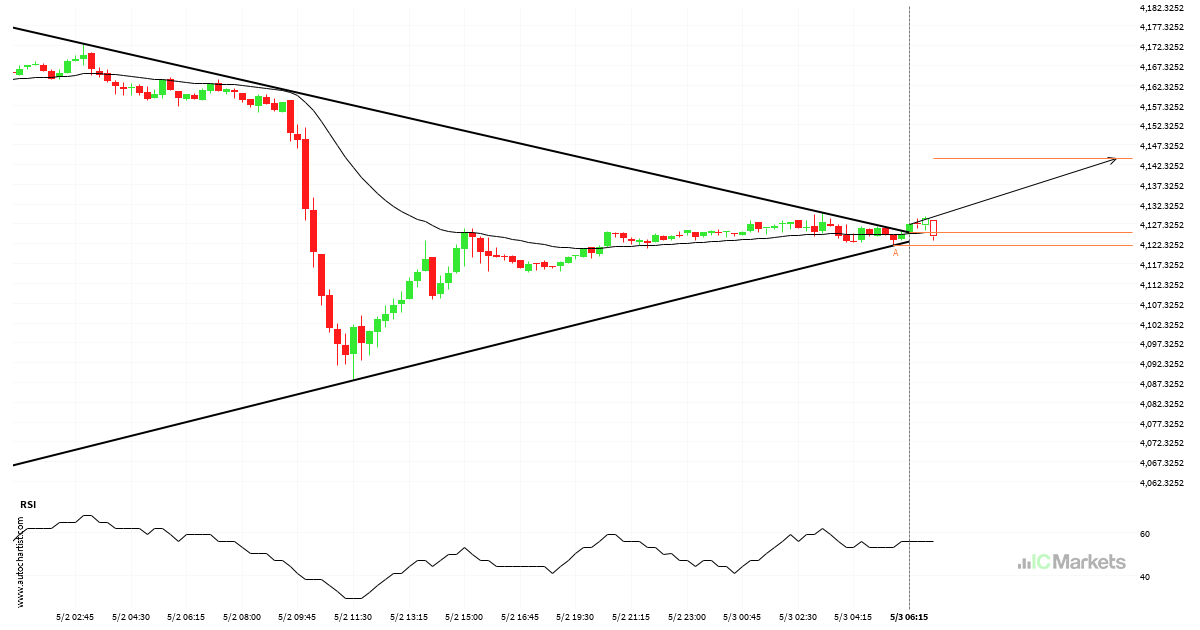
US SPX 500 Index has broken through resistance

US SPX 500 Index has broken through a resistance line. It has touched this line at least twice in the last 2 days. This breakout may indicate a potential move to 4143.9370 within the next 8 hours. Because we have seen it retrace from this position in the past, one should wait for confirmation of […]

Read more
May 2, 2023North_American_Stocks_ptIC Markets

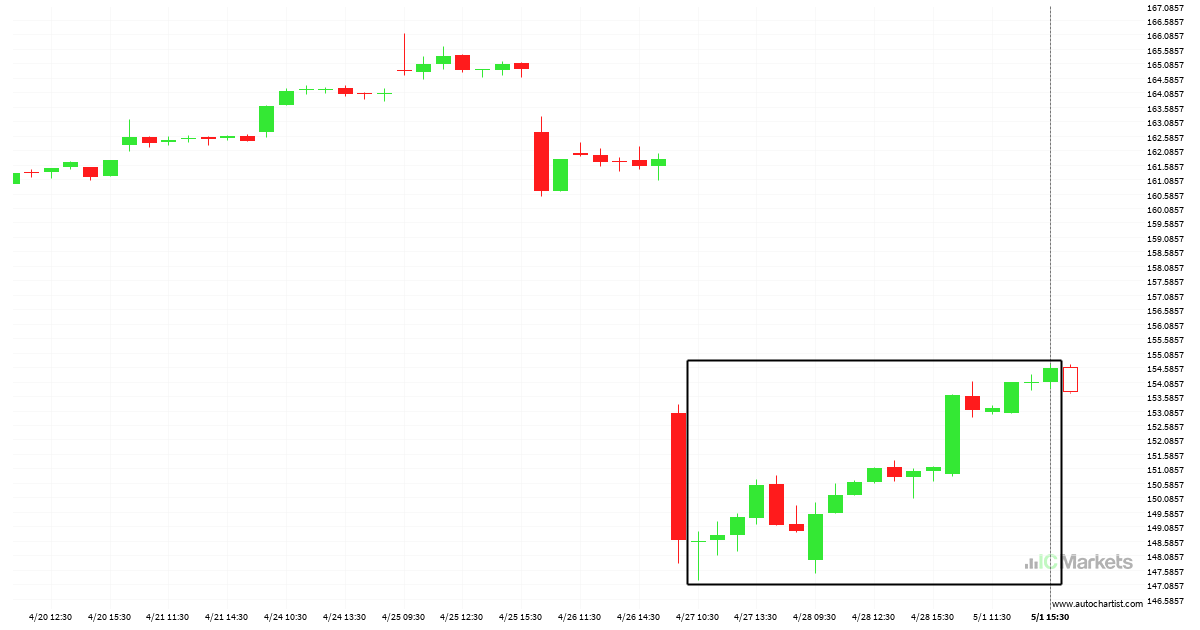
Huge bullish move on AbbVie

AbbVie has moved higher by 4,02% from 148.59 to 154.56 in the last 5 days.

Read more
May 1, 2023North_American_Stocks_ptIC Markets

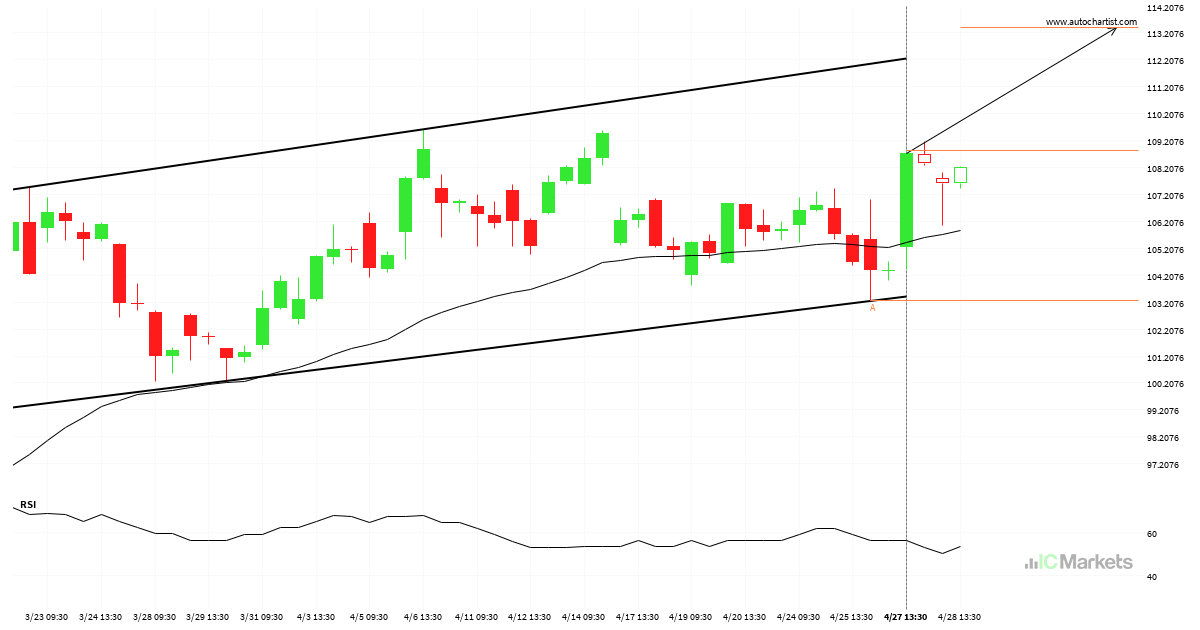
ALPHABET INC CLASS C approaching resistance of a Canal ascendente

ALPHABET INC CLASS C is approaching the resistance line of a Canal ascendente. It has touched this line numerous times in the last 46 days. If it tests this line again, it should do so in the next 2 days.

Read more
April 28, 2023North_American_Stocks_ptIC Markets

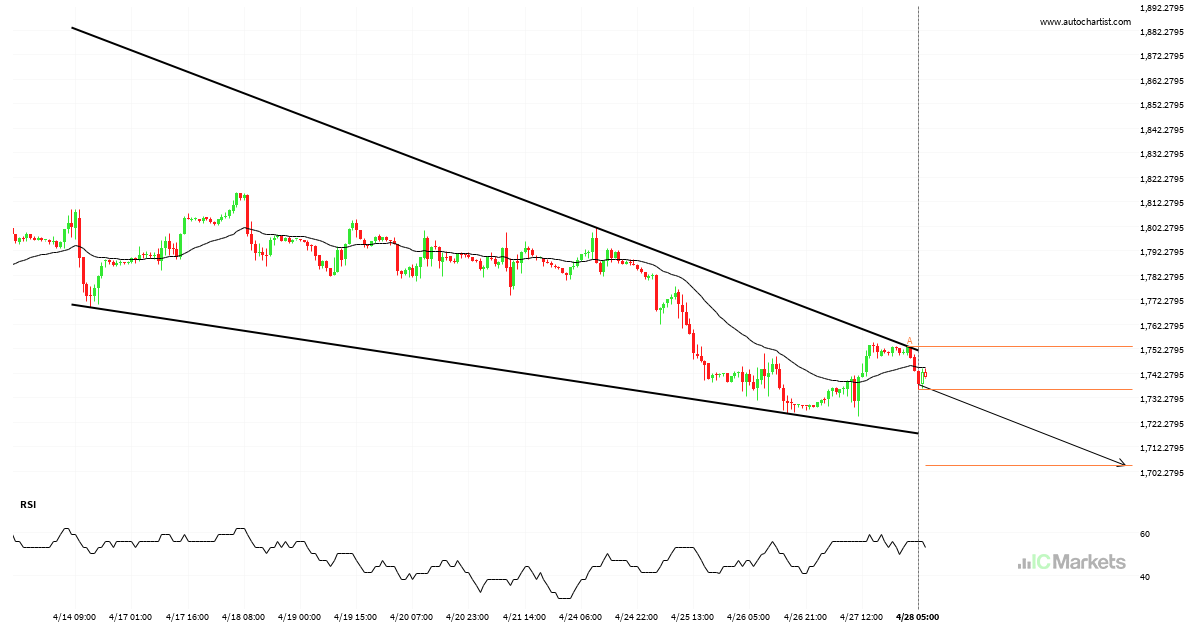
US Small Cap 2000 Index approaching support of a Cunha descendente

US Small Cap 2000 Index is approaching the support line of a Cunha descendente. It has touched this line numerous times in the last 14 days. If it tests this line again, it should do so in the next 3 days.

Read more
  • 1
  • 2
  • 3
  • …
  • 32
  • 33
  • 34
  • 35
  • 36
  • 37
  • 38
  • …
  • 87
  • 88
  • 89

Recent Posts

  • US Wall Street 30 Index – المستوى الرئيسي – مقاومة
  • Brent Oil vs US Dollar – نموذج الرسم البياني – قناة صاعدة
  • Brent Oil vs US Dollar – نموذج الرسم البياني – قناة صاعدة
  • Hong Kong 50 Index – نموذج الرسم البياني – مثلث صاعد
  • Hong Kong 50 Index – รูปแบบกราฟ – สามเหลี่ยมขาขึ้น

Recent Comments

    Translation


     Edit Translation

    Negocie com um

    líder de mercado no qual possa confiar

    ABRA UMA CONTA DE NEGOCIAÇÃO TESTE UM DEMO GRATUITO

    Trading com Forex

    • Visão Geral de Contas
    • Abrir uma Conta
    • Lançar Web Trader

    Especificações de Trading

    • Spreads e Comissões
    • Gama de Mercados
    • Horas de Trading
    • Financiamento
    • Levantamento

    Acerca da IC Markets?

    • Help Center
    • Porquê a IC Markets
    • Regulamentação
    • Documentos Legais
    • Contacte-nos


    Forex Trading

    • Accounts Overview
    • Open an Account
    • Launch Web Trader

    Trading Specifications

    • Spreads and Commissions
    • Range of Market
    • Trading Hours
    • Funding
    • Withdrawal

    About IC Markets

    • Chat with a Specialist 24/7
    • Why IC Markets
    • Regulation
    • Legal Documents
    • Contacte-nos

    Isenção de Responsabilidade: Este material corresponde a material de marketing em que todo o material de marketing é publicado apenas para fins informativos. Este material não contém e não deverá ser considerado como contendo - aconselhamento de investimento e recomendações ou sugestões para adotar quaisquer ações relativamente a instrumentos financeiros. Os widgets incorporados pertencem aos seus autores externos independentes e a IC Markets não é responsável pelo seu conteúdo ou pelo seu impacto na negociação.

    Todos os direitos de conteúdo reservados. As opiniões dos autores poderão não coincidir com a opinião dos editores do blog. Aquando da cópia de materiais a partir deste site ou aquando da ligação ao RSS feed, para republicar os nossos artigos, é necessário um link para a IC Markets ou a atribuição no formato 'IC Markets Blog'. Para questões gerais, por favor, entre em contato com a agência editorial através do formulário da nossa página de Contato.

    Alerta de Risco: A negociação de Derivados acarreta um elevado nível de risco para o seu capital e deverá negociar apenas com dinheiro cuja perda possa suportar. A Negociação de Derivados poderá não ser adequada para todos os investidores e, como tal, por favor, certifique-se de que entende plenamente os riscos envolvidos e procure aconselhamento independente, se necessário. Deverá ser considerada uma Declaração de Divulgação de Produto (PDS) antes de efetuar uma transação connosco.

    O conteúdo desta página corresponde apenas a informação geral e não tem em conta a sua situação pessoal, objetivos ou necessidades financeiras. Cabe-lhe a si certificar-se de que os produtos que nós oferecemos se adequam às suas necessidades específicas. Não deverá negociar connosco, a menos que entenda as caraterísticas e os riscos dos produtos que nós oferecemos. Isto significa que poderá precisar de procurar aconselhamento independente antes de começar a negociar connosco.

    © 2022 Raw Trading Ltd | All rights reserved.
    • Sample Page